
[ad_1]
After delivering excruciating pain to investors in the last week, the broader markets are looking to give some relief. The index bounced off the low made on Friday and is currently trading 1% up at 17,983 while the is showing more strength with a 1.28% rally to 42,196, by 12:01 PM IST.
Last week, was the only sectoral index that delivered some gains to investors, while on Monday, it is the only one trading in the red zone. That’s the kind of volatility that is going on in the market sentiments regarding the Covid-19 situation. As new developments from China and around the world would keep coming, this sentimental shift would keep oscillating but what the charts are telling? Should you buy this rally or wait for a meaningful recovery to initiate your shorts?
Well, most traders would agree that after an 890-point fall in the last three weeks, a counter-trend rally of 200 points is kind of justified. The market never goes down or up in a straight line. To look at the broader picture on the Nifty 50 from a quantitative perspective without the involvement of any bias or judgment, here I am using Fractals.
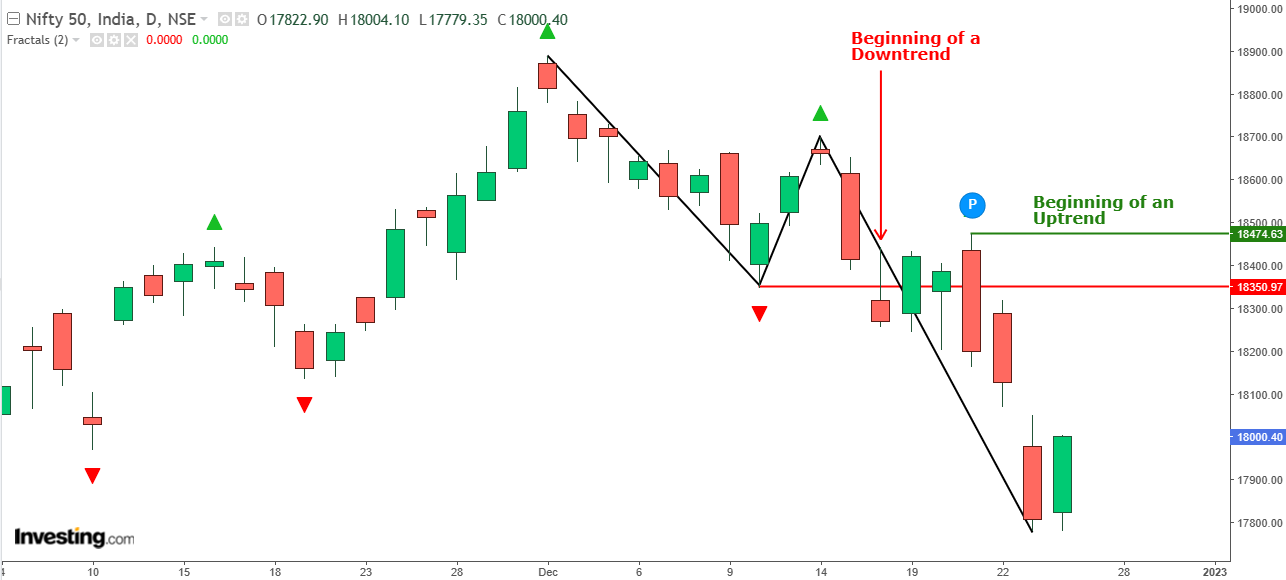
Image Description: Daily chart of Nifty 50
Image Source: Investing.com
Fractal is a very simple technical indicator that points out the highest high in a 5-session window, wherein the first two and the last two highs in this period must be lower than the middle one, and the middle high is called an up fractal and works as a resistance. The same goes for the lows. In any rolling 5-period window, if the first two and the last two lows are higher than the middle candle’s low, then this middle low is called a down fractal and works as a support. This might sound confusing but look at the chart above, see the green and red arrows (which are up fractals and down fractals, respectively) and look at the preceding two and succeeding two candles’ high (in the case of up fractal) and low (in the case of down fractal). After seeing the chart, read the above explanation again and you’ll understand how these fractals are forming.
Now, what do these fractals show? These up fractals are interpreted as resistance and the down fractals are support. Not just that, this fractal formation gives a crystal clear indication of the ongoing structural trend, in terms of higher highs and lower lows or vice versa. I have drawn black lines connecting these fractals. You can clearly see that currently it is forming a lower low and lower high formation, a classic representation of a downtrend.
This was the backbone of my analysis when I started expecting a downtrend in the Nifty 50 in my write-up which was published on 16 December 2022. I have marked the initiation of a downtrend with a red horizontal line when the Nifty fell below the down fractal of 18,345 on 16 December 2022.
As you can see, the current up fractal in the Nifty 50 is at 18,473 (hidden behind the P symbol on the chart). I have marked a horizontal green line to make it more clear. This is telling that it is the nearest resistance for the Nifty which needs to be crossed in order for it to start an uptrend. This is when the index would start to make a higher high. So, recovery from here is still not reflecting an uptrend, as per the fractal analysis. However, it may also happen, that over the course of the next few sessions, a new up fractal (resistance) may form which would then be the nearest level to mark the uptrend.
With that being said, a good bounce back from the lows can definitely occur which can also be played on the long side by those who are quick and nimble. But the structural trend would only change once a higher high and higher low formation starts to occur, which can clearly be seen via these fractals as they are nothing but peaks and troughs.
There are many ways to analyze the trend and this is just one of them.
PS – This is probably my last analysis of 2022 and you would be seeing more such pieces from the next year. So, here I am wishing each one of you and your families a very Happy New Year 2023 🙂 In the meantime, if you want to connect with me, my social media links are there under the bio tab on my profile page on Investing.
[ad_2]
Source link
(This article is generated through the syndicated feed sources, Financetin doesn’t own any part of this article)