
[ad_1]
Out of the entire listed universe on the NSE, one may find many long opportunities every day on the back of strong breakouts. However, it’s rare to come across a stock that gives a very long-term breakout, such as a decade-long one. One stock that came on my radar which is looking an absolute bliss for the long term (solely from the technical standpoint) is Power Finance Corporation Limited (NS:).
Yesterday, I analyzed REC Limited (NS:) which seemed ready to break its 5-year high and today, PFC marked a new 5-year high as it soared 4.44% to INR 156.35, by 10:48 AM IST, which is the highest level since May 2017. PFC and REC have a very high correlation and more or less move in tandem with each other, which makes sense as PFC owns a 52.6% stake in REC.
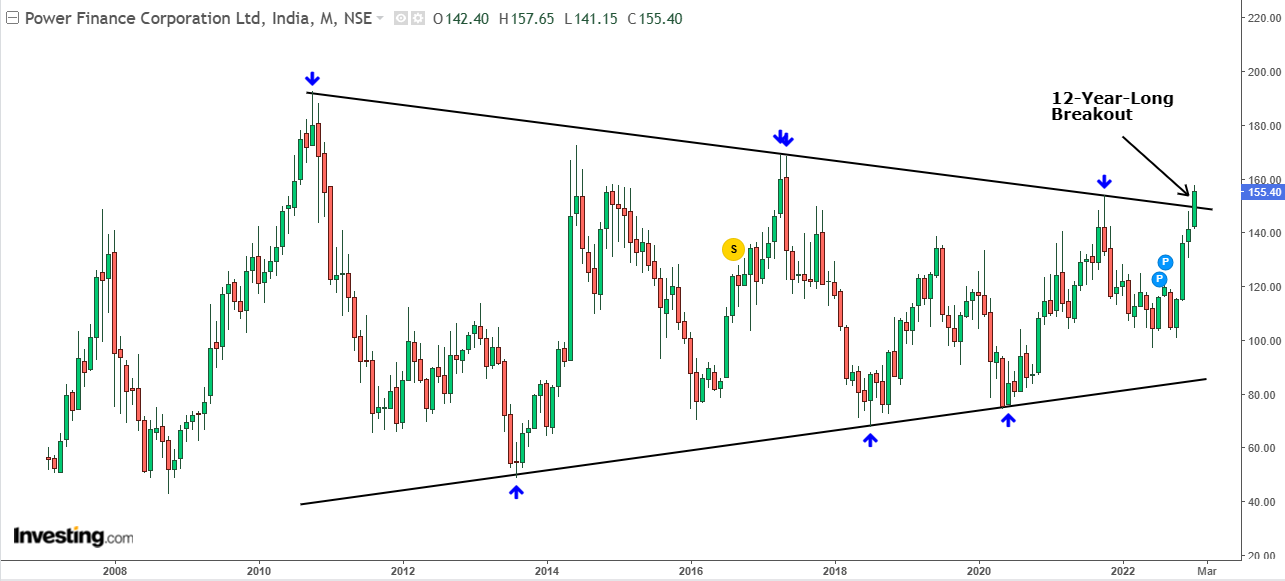
Image Description: Monthly chart of Power Finance Corporation
Image Source: Investing.com
If you zoom out and look at the bigger picture, the share price of PFC had been contracting in a narrowing range for the last 12 years. This can be seen by switching to a monthly chart on which one can clearly see the formation of a symmetrical triangle pattern. Although I generally don’t look at the monthly chart as it’s too large of a time frame for my liking, the chart of PFC is looking absolutely remarkable.
As can be seen from the chart above, the stock made a few attempts to break above the upper trendline in the last decade but failed every time. A similar price action was seen at the bottom wherein the stock tried to breach the lower trendline but bounced back from there. This sideways range kept on contracting for a very long time.
However, the stock’s 10% rally this month so far seems to be sufficient to deliver a breakout from this pattern. It’s the fourth consecutive month of gains for the stock which is reflecting the king of buying frenzy that is going on. If the stock retains this kind of gain by the month-end, then the breakout would finally be confirmed and the stock could soar to deliver a 2x return in the long term. Not to mention, it is a high dividend-paying company and currently trading at a yield of 8.5% which makes it even more attractive for the long term.
PS – The volume for this month cannot be gauged as of now as it’s only the second trading session so far.
It’s probably not the right idea to gauge a breakout on a monthly chart at the beginning of the month as anything can happen by the month-end. However, 12-year price data cannot be displayed properly via a daily or weekly chart.
Disclosure – I hold PFC shares in my portfolio.
[ad_2]
Source link
(This article is generated through the syndicated feed sources, Financetin doesn’t own any part of this article)